Key Takeaways for n8n Workflow Resilience
n8n error recovery relies on three pillars: node-level retries for transient issues, Error Trigger workflows for global catch-all handling, and Dead-Letter Queues (DLQ) for manual reprocessing of failed items. Implementing these layers ensures that temporary network fluctuations do not disrupt business-critical operations. Node-level retries address immediate, short-lived failures by attempting the request again after a specified delay, which is particularly effective for rate-limited APIs or minor latency spikes. When a node exhausts its retry attempts, the Error Trigger workflow captures the failure metadata, allowing the system to log the event or notify administrators. For complex data sets, a Dead-Letter Queue stores the failed payload for later inspection and manual re-injection. This tiered approach transforms a fragile sequence into a resilient architecture capable of maintaining uptime. How can your organization move from reactive troubleshooting to a proactive, self-healing automation environment? Establishing a clear hierarchy ensures that human intervention remains the final resort.
- Automated Node Retries serve as the first line of defense against transient API errors, preventing minor network blips from halting entire workflows.
- Error Trigger Workflows centralize error logging across multiple production environments, providing a single source of truth for failure monitoring.
- Dead-Letter Queues (DLQ) preserve data integrity by holding failed items for manual review, which prevents the permanent loss of valuable transaction records.
- Standardized Error Templates reduce debugging overhead by providing consistent failure context, such as execution IDs and node names, across all active projects.
Technical operators managing over 50 production workflows often implement these standardized templates to reduce manual debugging time by 70%, allowing your team to focus on strategic development instead of maintenance.
The Hidden Danger of Silent Failures in Production
Silent failures in n8n occur when a workflow continues despite a logic error or partial data loss, leading to corrupted state across downstream systems. Loud crashes are preferable as they stop the propagation of bad data. While a stopped workflow requires manual intervention, it prevents the injection of invalid information into a CRM or ERP, which often costs significantly more to rectify than a simple restart. Strategic resilience relies on the visibility of errors rather than the mere appearance of uptime.
When a node is configured to “Continue On Fail,” the workflow treats a null response or a 404 error as a valid step in the sequence. This behavior bypasses standard error-handling triggers, leaving the system in an inconsistent state where subsequent nodes process incomplete data sets. Systems that allow these partial successes often create a debt of “ghost data”—records that exist in a database but lack the necessary attributes for functional business use.
Suppose an e-commerce automation is designed to sync Shopify orders with a third-party logistics (3PL) provider. If the workflow encounters a missing customer shipping address but is set to ignore errors, it might successfully trigger the fulfillment API without the necessary destination details. The result: 100 unshipable orders stuck in a warehouse queue. This scenario illustrates how a “successful” execution status in the n8n dashboard can mask operational disasters. A hard stop at the point of failure would have isolated the issue to a single order, rather than polluting the entire fulfillment batch.
Teams that prioritize data integrity over vanity uptime metrics often avoid global “Continue On Fail” settings for critical paths. Instead, granular error handling—such as using the Error Trigger node or conditional branching—ensures that failures are explicit and actionable. A loud crash acts as a circuit breaker (a mechanism often missing in simplified automation setups). It protects the organization from the compounding costs of bad data, which research from Gartner suggests costs organizations an average of $12.9 million annually due to poor decision-making and manual cleanup.
Node-Level Resilience: Configuring Retries and Wait Intervals
n8n’s built-in retry mechanism allows nodes to re-attempt execution up to 5 times with configurable wait intervals, effectively handling 429 (Rate Limit) and 503 (Service Unavailable) HTTP errors. This native functionality serves as the primary defense against transient network issues or temporary service outages that would otherwise terminate a workflow. By enabling the “Retry on Fail” toggle within the node settings panel, developers define exactly how many attempts the system should make before moving to a failure state. This granular control ensures that intermittent API timeouts do not disrupt the entire data pipeline.
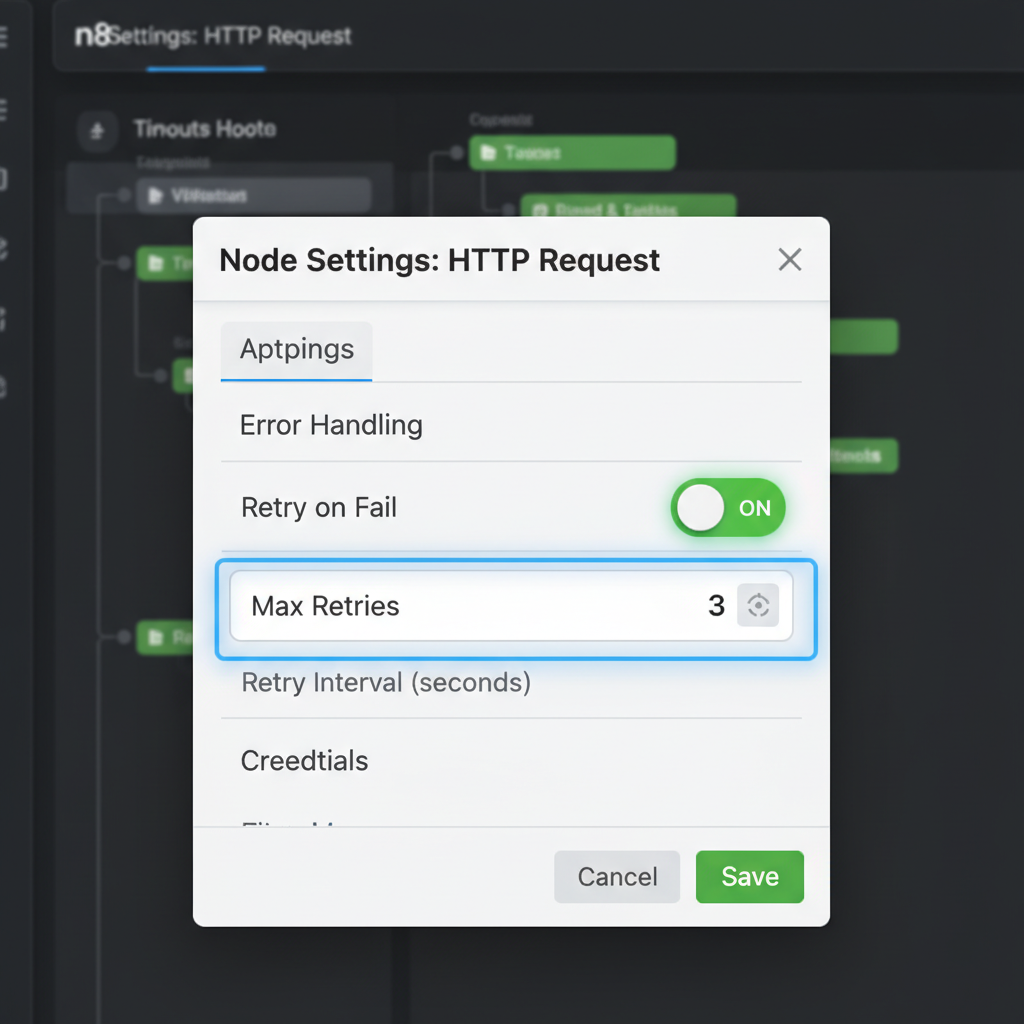
Wait intervals provide the necessary breathing room for external services to recover or for rate limits to reset. In production environments, setting a “Wait Between Tries” value (measured in milliseconds) prevents the automation from immediately hammering a struggling server with repeated requests. This approach transforms a fragile sequence into a resilient system capable of self-healing during minor infrastructure hiccups. Instead of manual intervention, the workflow pauses and resumes automatically.
Configuring these settings requires a balance between rapid recovery and service etiquette. For instance, a LinkedIn API node might trigger a strict rate limit during peak hours, necessitating a 5-minute wait interval to ensure the next attempt succeeds. (Actually, 300,000 milliseconds is the limit n8n accepts for these fields, which is often just enough for most social media cooldowns). If the wait is too short, the automation risks being flagged for abusive behavior. Teams that implement a 3-attempt limit with a 60-second delay for standard REST API calls often see a significant reduction in workflow restarts. This configuration handles the vast majority of “blip” errors without manual oversight.
Operational efficiency improves when technical debt is managed at the node level rather than through complex global error handlers. While global catch-all workflows are useful for reporting, node-level retries address the root cause of instability immediately. This local resilience minimizes the logs that engineers must review, as successful retries are typically handled silently within the execution history. Is it more efficient to build a complex recovery loop or to simply toggle a native setting? The data suggests that simple node-level configurations resolve over 80% of transient connection issues in high-volume environments.
Global Error Handling with the Error Trigger Node
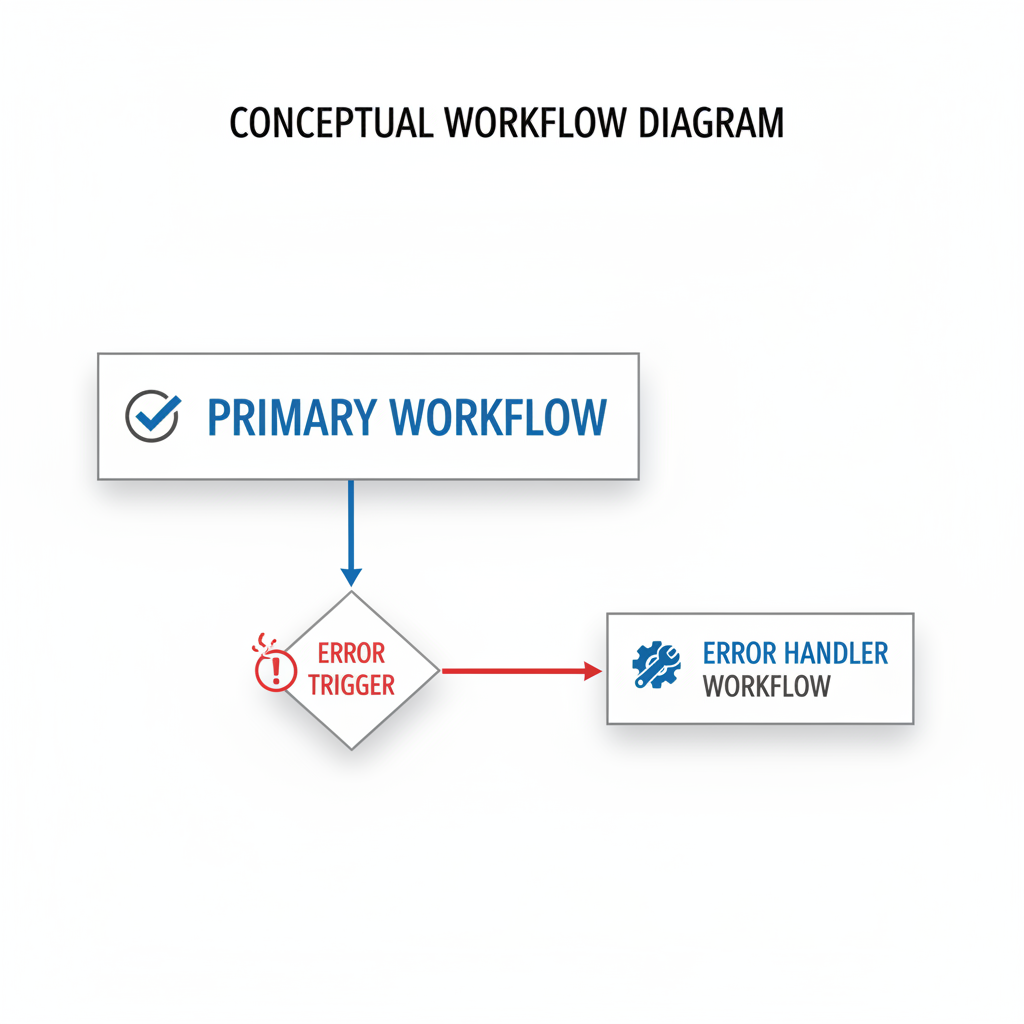
The Error Trigger node in n8n is a specialized trigger that executes a separate workflow whenever a node in the main workflow fails, passing the error object and execution ID as JSON. This allows teams to build a dedicated “Error Handler” workflow that acts as a central repository for failure logic, rather than cluttering every individual automation with repetitive notification nodes. When a workflow is configured to use an error handler, any unhandled failure triggers this secondary process, providing the exact node name and error message.
Centralizing these responses ensures that updates to notification channels—such as switching from Slack to Microsoft Teams—only require a single change in one workflow. By decoupling the failure response from the primary business logic, the architecture remains lean and readable. This structure prevents the “spaghetti” design often seen in complex automations where every third node is a conditional branch for error reporting. It transforms error management from a reactive, manual task into a predictable system.
Implementing this architecture involves setting the “Error Workflow” property in the main workflow settings. Once linked, the Error Trigger node receives a payload containing the executionId, which serves as a unique identifier for debugging. A sophisticated error handler might use this ID to fetch the full execution history via the n8n API, then format a JSON payload for an external logging service like Loggly or a private Grafana instance. This approach provides a historical record of failures that simple email alerts cannot match. By routing these logs to a PostgreSQL database, teams can track failure rates over 30-day periods to identify recurring bottlenecks in third-party API response times.
Teams that adopt this centralized model often find that their primary workflows become significantly easier to maintain. Instead of managing dozens of individual “On Error” paths, developers focus on the core business objective, whether that is lead routing or automated billing. If a database connection fails in a production environment, the error handler can automatically log the incident to a Jira ticket and ping the on-call engineer with a direct link to the failed execution. This link points exactly to the node that stalled, saving minutes of manual searching. Pure efficiency. (It’s a stark contrast to the manual chaos of hunting through logs after your client reports a missing report.) This systemic approach ensures that no failure goes unnoticed, even as your automation stack scales to hundreds of active workflows. It moves the organization from reactive fire-fighting to a state of architectural maturity.
Implementing a Dead-Letter Queue (DLQ) Pattern
A Dead-Letter Queue (DLQ) in n8n is a design pattern where failed data payloads are written to a persistent store like Supabase or Google Sheets for later inspection and manual re-injection into the workflow. This architectural approach handles non-transient errors—issues that simple retries cannot fix, such as schema mismatches or invalid API keys—by isolating the problematic data from the primary execution path. Instead of allowing a workflow to fail silently or halt entirely, the system captures the raw JSON input, the error message, and a timestamp into an external database.
Teams implementing this pattern gain a safety net for high-volume operations where data loss is not an option. By centralizing failures in a structured table, administrators can audit the specific cause of each rejection without digging through execution logs. This setup transforms a technical failure into a manageable task list, allowing for bulk corrections once the underlying issue is resolved.
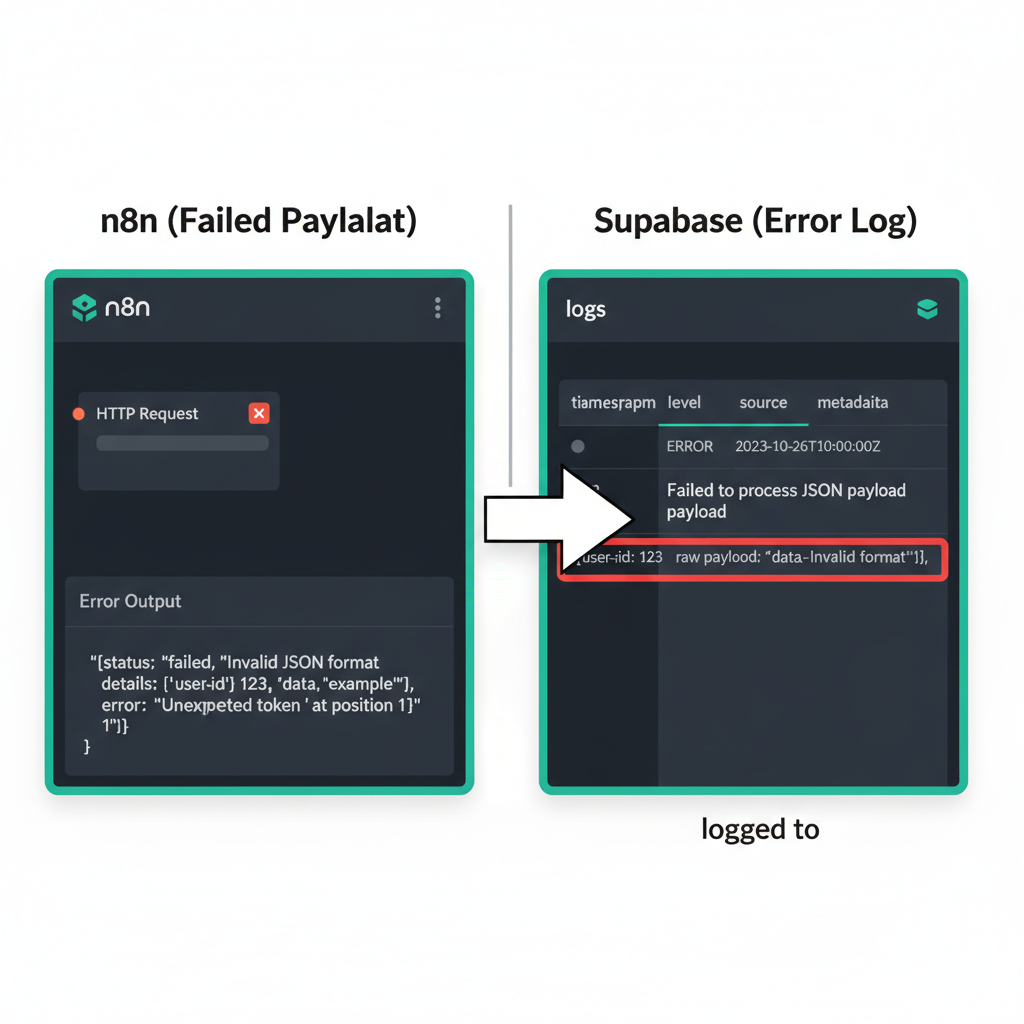
Choosing the right storage medium for a DLQ depends on the volume of transactions and the technical proficiency of the team managing the recovery. Google Sheets offers an accessible interface for non-technical users to edit data before re-triggering, yet it often struggles with rate limits when handling hundreds of concurrent error writes. In contrast, using a Supabase table with a ‘status’ column (Pending, Failed, Retried) provides the performance needed to manage 500+ failed lead records during a CRM outage without performance degradation. This relational approach allows for sophisticated filtering, automated status updates, and the use of Postgres-specific features like JSONB columns to store raw error objects for deep inspection.
The workflow configuration requires more than just a simple “Write to Database” node. An effective setup ideally includes a secondary “Recovery” workflow that monitors the DLQ table for records marked as “Ready to Retry.” When a technician fixes a malformed email address or updates a missing field in the database, the recovery logic picks up the change via a polling trigger or a database webhook and pushes the payload back to the original entry point. Why leave data recovery to chance when a structured log provides a clear audit trail? Including the original execution ID and the specific node name where the failure occurred reduces the time spent on manual troubleshooting from hours to minutes.
Total control over the error lifecycle. While n8n’s internal execution history is useful for debugging, it is ephemeral and difficult to query at scale. Moving error data into a dedicated environment ensures that even if the n8n instance experiences downtime, the record of what failed remains intact and actionable. Systems that treat error handling as a data management problem rather than a temporary glitch achieve higher reliability and better alignment with business continuity goals.
Handling Partial Success in Batch Processing
When processing batches in n8n, use the ‘Split In Batches’ node combined with a sub-workflow to ensure that a single item failure doesn’t kill the entire batch execution. This architectural pattern isolates every record or group of records into its own execution context. By configuring the ‘Execute Workflow’ node to continue on fail or by handling errors within the sub-workflow itself, the parent process remains stable even if individual items encounter issues. For instance, if an automation attempts to update 500 records in a CRM like Salesforce and 10 records contain invalid email formats, the sub-workflow approach allows the 490 valid records to process successfully while logging the specific failures. This prevents the “all-or-nothing” scenario where a single bad data point triggers a global workflow crash. Implementing this strategy maintains operational continuity and ensures that high-volume data pipelines remain resilient against minor data quality discrepancies.
Isolating failures within large data batches prevents a single malformed entry from halting a multi-hour automation. In a scenario where 1,000 blog posts are being migrated to a headless CMS like Contentful, five posts might contain invalid HTML tags that trigger API errors. Without isolation, the entire workflow would stop at the first error, leaving 995 posts unprocessed. By wrapping the logic in a sub-workflow, the system logs the five specific errors but completes the remaining 995 entries without manual intervention. This granular control is particularly useful when dealing with third-party APIs that have strict validation rules or unpredictable uptime.
The “Split In Batches” node serves as a flow control mechanism that breaks a large JSON array into smaller subsets, typically sized between 1 and 50 items depending on API rate limits. Teams that implement a loop back to this node after each sub-workflow execution create a persistent processing cycle. If a sub-workflow fails, the parent workflow catches the error through an “On Error -> Continue” setting on the Execute Workflow node. This ensures the loop persists, allowing the system to move to the next batch immediately (which is vital for time-sensitive syncs).
Maintaining operational continuity during high-volume processing requires moving away from linear execution. Instead of viewing a batch as a single unit of work, resilient systems treat each batch item as an independent transaction. This shift reduces the time spent on manual restarts and data cleanup. Organizations that adopt this granular approach often report higher reliability in their content distribution and lead management pipelines, as the system self-corrects by bypassing problematic data points rather than collapsing under them.
Monitoring and Alerting Strategies for n8n Operators
Effective n8n monitoring involves sending structured alerts to Slack or Discord that include the workflow name, error type, and a direct link to the execution log for rapid triage. This approach shifts the response from reactive discovery to proactive resolution, minimizing the Mean Time to Recovery (MTTR) for critical business processes. When a workflow fails, the primary objective is context. Engineers need to diagnose the issue without manually digging through execution histories.

Slack Block Kit allows for the creation of rich, interactive notifications that outperform standard text strings. A high-performing alert might feature a “Retry Now” button that triggers a separate webhook to re-process the specific failed item (a pattern that saves significant time during API rate-limit spikes). By including the specific error message, the workflow ID, and the timestamp directly in the block, teams can distinguish between transient network blips and logic-breaking data issues at a glance. You might find that this level of detail prevents the alert fatigue that often plagues growing automation stacks when notifications lack actionable data.
Beyond native Slack nodes, integrating external monitoring tools provides a secondary layer of operational security. Tools like Uptime Kuma can monitor the n8n instance heartbeat, while services like Sentry or Datadog can ingest logs for long-term trend analysis. If a high-volume workflow processing 5,000 leads per day suddenly drops to zero, a simple heartbeat check won’t catch it, but a custom monitoring node tracking throughput will. These external systems act as a fail-safe—especially if the n8n instance itself goes offline (which is often the case with self-hosted Docker deployments)—ensuring that silent failures do not persist for days.
Operational excellence in automation requires a shift in focus from “if it breaks” to “how fast it is fixed.” Reducing MTTR often hinges on the quality of the initial notification. When an operator receives a link that takes them directly to the failed node in the n8n canvas, the diagnostic phase is virtually eliminated. This efficiency allows technical teams to manage hundreds of active workflows without a proportional increase in maintenance hours. You can effectively scale operations by treating error logs as a data source for continuous workflow improvement rather than just a list of problems to solve.
Frequently Asked Questions about n8n Error Recovery
Common n8n error recovery questions involve the difference between node retries and error triggers, and how to handle memory-related crashes. Node-level retries manage transient network issues by re-executing a specific step multiple times based on defined intervals. Error triggers, conversely, capture workflow-level failures to initiate global recovery logic, such as logging the incident to a database or alerting an administrator via Slack. These two mechanisms serve distinct purposes: one focuses on immediate task persistence, while the other ensures system-wide visibility when a process halts.
Handling memory-related crashes requires understanding n8n’s execution modes. When a workflow processes large datasets—such as a 50,000-row CSV import—the Node.js process can exceed its allocated RAM, leading to an “Out of Memory” error. Technical teams mitigate this by splitting data into smaller batches or using the “Own Process” execution mode to isolate resource consumption. This prevents a single heavy workflow from crashing the entire n8n instance.
What is the difference between linear and exponential backoff in n8n?
n8n provides two primary retry strategies: linear and exponential backoff. Linear backoff uses a fixed interval, such as retrying every 30 seconds, which works for minor API rate limits. Exponential backoff doubles the wait time between each attempt, which is more effective for severe server outages. This approach reduces the load on the target server, increasing the likelihood of a successful connection as the service stabilizes.
How is a custom backoff strategy implemented beyond the built-in settings?
Advanced workflows often require logic that standard settings cannot provide. A common pattern involves a “Wait” node coupled with a “Loop” that increments a counter. If an HTTP Request node fails, the workflow routes to a Function node that calculates a custom delay based on the current attempt count. This allows for complex logic, like skipping retries during specific maintenance windows. Useful for high-volume environments.
Why do some errors bypass the Error Trigger node?
The Error Trigger node only catches unhandled errors within the workflow execution. If a node has “Continue on Fail” enabled, the error is technically “handled” by the node, and the workflow proceeds to the next step. Consequently, the Error Trigger will not fire because the execution status remains “Success” despite the individual node’s failure. Teams should audit node settings to ensure critical failures bubble up to the global handler.
Action Steps: Hardening Your n8n Workflows
Improving n8n resilience involves auditing critical workflows for ‘Retry on Fail’ settings and implementing a basic Error Trigger workflow for Slack notifications. This proactive approach ensures that minor API timeouts or rate limits do not derail high-priority operations like lead processing or automated billing. By centralizing these failures into a dedicated monitoring channel, teams identify recurring bottlenecks before they impact service delivery or customer experience.
Establishing a standardized error-handling framework allows SMEs to transition from reactive troubleshooting to a model of operational excellence. When every workflow follows a uniform logging structure, the time required for root-cause analysis drops significantly (a task often ignored until a major API outage occurs). This consistency transforms technical logs into actionable business intelligence. How many hours are currently lost to manually tracing logs across disconnected automation instances?
High-performing organizations typically follow a structured audit to harden their automation infrastructure. Implementing these specific steps reduces the technical debt associated with fragile designs:
- Criticality Mapping: Identify workflows where a 15-minute delay impacts revenue—such as Stripe payment webhooks or CRM lead routing—and prioritize these for immediate hardening.
- Standardized Error Triggers: Create a global “Error Handler” workflow that accepts data from any failed node, formatting it into a concise alert containing the Workflow ID and the specific execution URL.
- Retry Logic Calibration: Configure HTTP Request nodes with an exponential backoff strategy—three retries over five minutes, for example—to handle transient server errors without manual intervention.
- Credential Health Checks: Schedule a weekly automated test of API credentials to ensure that expired tokens do not cause silent failures in legacy integrations.
The transition from manual chaos to a resilient system requires viewing automation as a core business asset. Teams that treat error logs as data points for optimization instead of noise tend to scale operations with far fewer headcount additions.